
- 0
- taikun
- 조회 수 51
**볼린저 밴드 일간 차트**
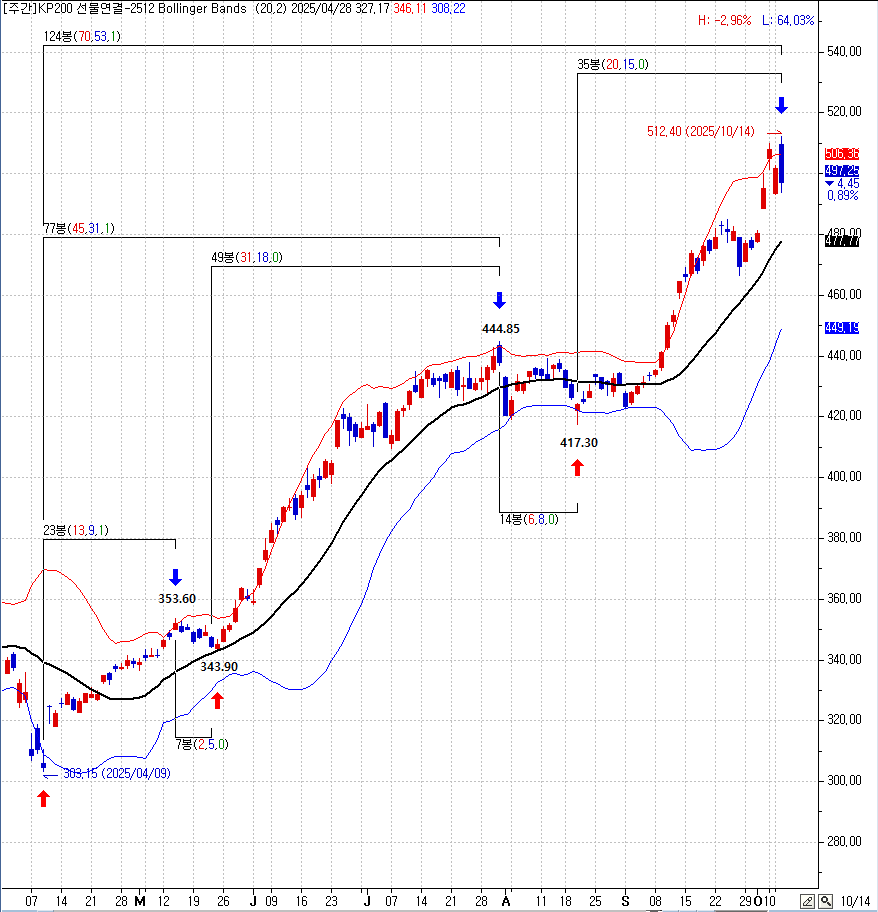
303.15 바닥......볼린저 하단 밴드 바닥
353.60 천정......볼린저 상단 밴드 천정
343.90 바닥......볼린저 미들 밴드 바닥......상승 추세 시작
444.85 천정......볼린저 상단 밴드 천정
417.30 바닥......볼린저 하단 밴드 바닥
512.40 현재......볼린저 상단 밴드 천정
**볼린저 밴드 틱 차트
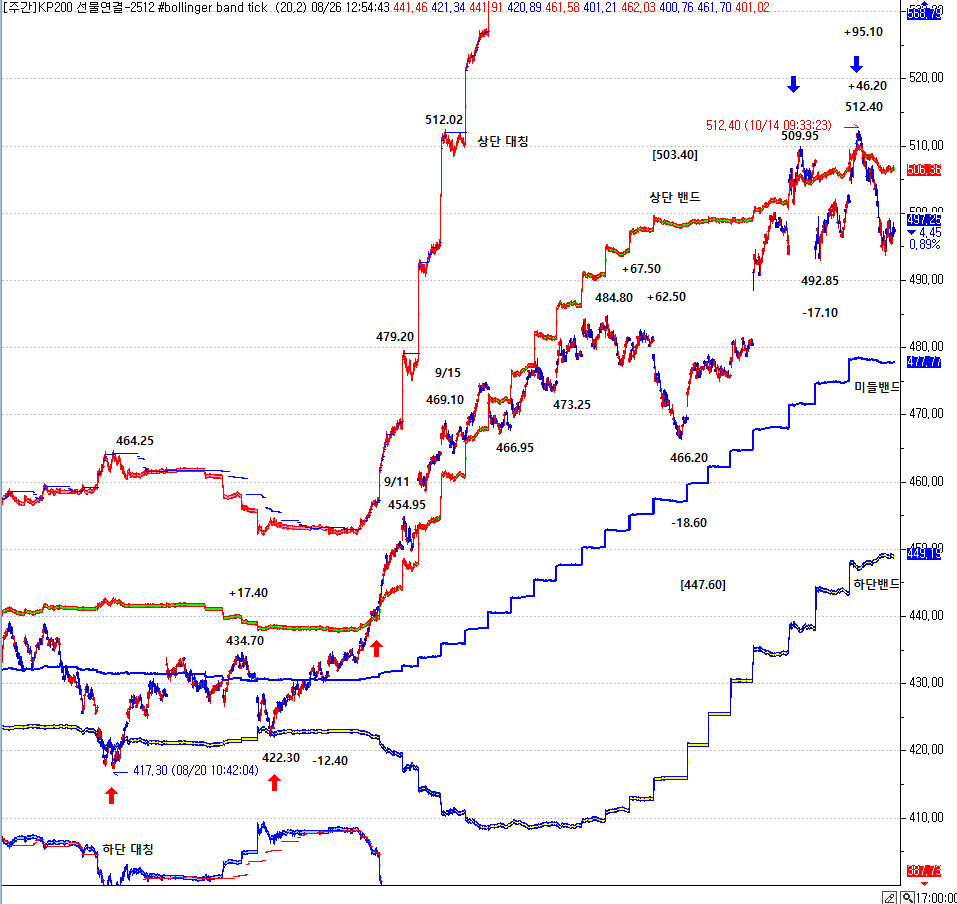
417.30 바닥......볼린저 하단 밴드 바닥
434.70 천정......볼린저 상단 밴드 천정......노터치
422.30 바닥......볼린저 하단 밴드 바닥
484.80 천정......볼린저 상단 밴드 천정......노터치
466.20 바닥......볼린저 미들 밴드 바닥......노터치......수렴
512.40 천정......볼린저 상단 밴드 천정
현재 밴드 위치
상단 밴드=506.36......저항선
미들 밴드=477.77......지지선......1차
하단 밴드=449.19......지지선......2차
2차 상승의 특징......상단 밴드 돌파후 상승 지속
3차 상승의 특징......상단 밴드 돌파후 하락 반전
영어 칼럼1: "Stock Prices Move by Statistics: The Data Behind Market Behavior"
The stock market is often portrayed as a realm of chaos, driven by emotions, news headlines, and unpredictable events. Yet, beneath the surface, markets adhere to statistical principles that shape their behavior. From volatility patterns to risk assessments, statistics are the invisible hand guiding stock prices. Understanding this can transform investing from a gamble into a science.
At its core, stock price movement reflects the aggregation of countless data points: earnings reports, macroeconomic indicators, trading volumes, and investor sentiment. Statistical models, such as the Capital Asset Pricing Model (CAPM), quantify risk and return by analyzing historical data. Volatility, measured through standard deviation, is a statistical metric that predicts the magnitude of price swings. Even the concept of "regression to the mean"—where extreme performance tends to revert toward average outcomes—is a statistical law observable in markets.
Probability distributions further illuminate market dynamics. The bell curve, or normal distribution, helps model returns, though markets often exhibit "fat tails" (rare but extreme events) that defy traditional models. Monte Carlo simulations, which run thousands of randomized scenarios, allow investors to stress-test portfolios against statistical likelihoods. Behavioral finance even quantifies human irrationality: studies show that investor overreaction and herd mentality follow predictable statistical patterns.
Critics argue that past data cannot predict the future, especially during "black swan" events. However, statistics do not claim to foresee every crisis but rather to manage uncertainty. Diversification, for instance, is a statistical strategy: by holding uncorrelated assets, investors reduce the impact of any single outlier. Value investing, too, relies on statistical edges—buying undervalued stocks with high probability of mean reversion.
In an age of big data and AI, statistical analysis has become indispensable. Algorithmic trading systems process terabytes of data daily, identifying patterns invisible to the human eye. Sentiment analysis tools parse news articles and social media to gauge market mood, translating qualitative noise into quantitative signals.
The takeaway is clear: while markets may seem erratic, they are bound by statistical laws. Investors who embrace this reality—learning to interpret data, respect probability, and mitigate risk—are better equipped to navigate the markets. Statistics may not predict the future, but they offer the closest thing to a roadmap through the uncertainty.
한글 번역1: "주가는 통계로 운동한다: 시장 행동의 데이터"
주식 시장은 종종 감정, 뉴스 헤드라인, 예측 불가능한 사건에 의해 움직이는 혼란의 영역으로 묘사됩니다. 그러나 그 이면에는 시장 행동을 형성하는 통계적 원리가 숨어 있습니다. 변동성 패턴부터 리스크 평가까지, 통계는 주가를 이끄는 보이지 않는 손입니다. 이를 이해하면 투자는 도박이 아닌 과학으로 변모합니다.
주가 변동의 핵심은 무수한 데이터 포인트의 집합입니다: 실적 보고서, 거시 경제 지표, 거래량, 투자자 심리 등. 자본자산가격결정모델(CAPM)과 같은 통계 모델은 역사적 데이터를 분석해 위험과 수익을 정량화합니다. 표준편차로 측정되는 변동성은 가격 변동의 크기를 예측하는 통계적 지표입니다. 심지어 "평균 회귀" 개념—극단적 성과가 평균으로 회귀하는 경향—도 시장에서 관찰되는 통계적 법칙입니다.
확률 분포는 시장 역학을 더욱 명확히 합니다. 정규 분포(종 모양 곡선)는 수익률을 모델링하는 데 사용되지만, 시장은 종종 "뚱뚱한 꼬리"(드물지만 극단적인 사건)를 보이며 전통적 모델을 벗어납니다. 수천 번의 무작위 시나리오를 실행하는 몬테카를로 시뮬레이션은 투자자가 통계적 가능성에 대비해 포트폴리오를 스트레스 테스트하도록 돕습니다. 행동경제학은 인간의 비이성까지도 정량화합니다: 연구에 따르면 투자자의 과잉 반응과 군집 행동은 예측 가능한 통계적 패턴을 따릅니다.
비판론자들은 과거 데이터가 미래를 예측할 수 없으며, 특히 "블랙 스완" 사건 시기에는 더욱 그렇다고 주장합니다. 그러나 통계는 모든 위기를 예측하려는 것이 아니라 불확실성을 관리하는 도구입니다. 예를 들어, 분산 투자는 통계적 전략입니다: 상관관계가 낮은 자산을 보유함으로써 단일 이상치의 영향을 줄입니다. 가치 투자 역시 통계적 우위에 의존합니다—평균 회귀 확률이 높은 저평가 주식을 매수하는 것이죠.
빅데이터와 AI 시대에는 통계 분석이 필수 불가결해졌습니다. 알고리즘 트레이딩 시스템은 매일 테라바이트 단위의 데이터를 처리해 인간의 눈으로는 보이지 않는 패턴을 발견합니다. 감성 분석 도구는 뉴스와 소셜 미디어를 파싱해 시장 분위기를 측정하며, 질적 소음을 양적 신호로 변환합니다.
결론은 명확합니다: 시장이 혼란스러워 보여도 통계적 법칙에 묶여 있습니다. 데이터를 해석하고 확률을 존중하며 리스크를 관리하는 투자자는 시장을 더 잘 헤쳐나갈 수 있습니다. 통계는 미래를 예측하지는 못하지만, 불확실성 속의 가장 가까운 로드맵을 제공합니다.
영어 칼럼2: "Bollinger Bands and Statistics: How Probability Shapes Market Analysis"
Bollinger Bands, a staple in technical analysis, are not just visual tools—they are rooted in statistical principles that transform raw price data into probabilistic insights. Composed of a middle band (a 20-day simple moving average) and two outer bands (each ±2 standard deviations from the middle band), they encapsulate the dynamic relationship between price, volatility, and probability.
The Statistical Foundation
At their core, Bollinger Bands rely on standard deviation, a measure of dispersion in statistics. In a normal distribution, 95% of data points lie within ±2 standard deviations from the mean. Applied to markets, this implies prices should theoretically stay within the bands 95% of the time—if price movements were normally distributed. However, financial markets often exhibit "fat tails," meaning extreme events occur more frequently than a normal distribution would predict. This deviation underscores a critical lesson: while Bollinger Bands provide a statistical framework, markets are not bound by textbook rules.
Probability in Practice
Traders use Bollinger Bands to gauge the likelihood of price reversals. When prices touch or exceed the upper band, it signals overbought conditions, increasing the probability of a pullback. Conversely, touching the lower band suggests oversold conditions and a potential bounce. Yet, in trending markets, prices can "ride the bands" for extended periods, defying the assumption of mean reversion. This highlights the importance of context: probability in trading is about weighing odds, not guaranteeing outcomes.
Volatility, another statistical concept, is embedded in Bollinger Bands. The bands widen during high volatility (reflecting increased uncertainty) and contract during low volatility (suggesting complacency). A "Bollinger Band Squeeze," where bands narrow significantly, is a high-probability setup for a breakout—though the direction remains uncertain. Traders often combine this with momentum indicators (e.g., RSI) to tilt the odds in their favor.
Limitations and Real-World Applications
While Bollinger Bands are powerful, they are not infallible. Their reliance on historical data means they lag behind real-time price action. Additionally, markets can remain overbought or oversold for prolonged periods during strong trends. To mitigate this, disciplined traders use Bollinger Bands as one piece of a broader strategy, incorporating risk management (e.g., stop-loss orders beyond the bands) and complementary tools.
In essence, Bollinger Bands bridge statistics and market psychology. They remind us that every price movement carries a hidden probability, and successful trading hinges on respecting these odds while acknowledging the unpredictability of finance.
한글 해석2: "볼린저 밴드와 통계: 확률이 시장 분석을 형성하는 방식"
기술적 분석의 필수 도구인 볼린저 밴드는 단순한 시각적 도구를 넘어, 통계적 원리에 뿌리를 둔 확률적 통찰력을 제공합니다. 중간 밴드(20일 단순 이동평균)와 상단/하단 밴드(각각 중간에서 표준편차 ±2만큼 떨어진 위치)로 구성된 이들은 가격, 변동성, 확률 간의 역동적 관계를 포착합니다.
통계적 기반
볼린저 밴드의 핵심은 표준편차라는 통계 개념입니다. 정규 분포에서 95%의 데이터 포인트는 평균에서 ±2 표준편차 내에 위치합니다. 이를 시장에 적용하면, 이론적으로 가격은 밴드 내에서 95%의 시간을 보내야 합니다—단, 가격 변동이 정규 분포를 따른다는 가정 하에 말입니다. 그러나 금융 시장은 종종 "뚱뚱한 꼬리"를 보이며, 극단적 사건이 정규 분포보다 더 자주 발생합니다. 이는 중요한 교훈을 줍니다: 볼린저 밴드는 통계적 틀을 제공하지만, 시장은 교과서적 규칙에 얽매이지 않습니다.
실전에서의 확률 활용
트레이더들은 볼린저 밴드를 통해 가격 반전 가능성을 가늠합니다. 가격이 상단 밴드를 터치하거나 넘으면 과매수 신호로 간주되어 조정 가능성이 높아지고, 하단 밴드 접촉은 과매도 신호로 반등 기대감을 높입니다. 그러나 강한 추세장에서는 가격이 밴드를 따라 장기간 "주행"하며 평균 회귀를 무시하기도 합니다. 이는 맥락의 중요성을 강조합니다: 트레이딩에서의 확률은 결과를 보장하는 것이 아니라, 승률을 저울질하는 것입니다.
변동성, 또 다른 통계적 개념,은 볼린저 밴드에 내장되어 있습니다. 밴드는 변동성이 높을 때 넓어지고(불확실성 증가), 낮을 때 좁아집니다(안주 상태). 밴드가 크게 좁아지는 "스퀴즈" 현상은 돌파 가능성을 시사하는 고확률 설정입니다—방향은 불확실하지만요. 트레이더들은 이를 모멘텀 지표(예: RSI)와 결합해 승률을 높입니다.
한계와 실제 적용
볼린저 밴드는 강력하지만 완벽하지 않습니다. 과거 데이터에 의존하기 때문에 실시간 가격 움직임에 뒤처집니다. 또한, 강한 추세장에서는 장기간 과매수/과매도 상태가 지속될 수 있습니다. 이를 보완하기 위해, 훈련된 트레이더들은 볼린저 밴드를 더 넓은 전략의 일부로 사용하며, 리스크 관리(예: 밴드 바깥 손절매)와 보완적 도구를 결합합니다.
결국 볼린저 밴드는 통계와 시장 심리를 연결하는 다리입니다. 모든 가격 움직임에는 숨은 확률이 있으며, 성공적인 트레이딩은 이러한 확률을 존중하면서도 금융의 예측 불가능성을 인정하는 데 달려 있습니다.
https://bookk.co.kr/bookStore/689538d224a032c75f83da38


